O프로파일
OProfile is a low overhead, system-wide performance monitoring tool. It uses the performance monitoring hardware on the processor to retrieve information about the kernel and executables on the system, such as when memory is referenced, the number of L2 cache requests, and the number of hardware interrupts received. On a Fedora system, the oprofile package must be installed to use this tool.
Many processors include dedicated performance monitoring hardware. This hardware makes it possible to detect when certain events happen (such as the requested data not being in cache). The hardware normally takes the form of one or more counters that are incremented each time an event takes place. When the counter value increments, an interrupt is generated, making it possible to control the amount of detail (and therefore, overhead) produced by performance monitoring.
OProfile uses this hardware (or a timer-based substitute in cases where performance monitoring hardware is not present) to collect samples of performance-related data each time a counter generates an interrupt. These samples are periodically written out to disk; later, the data contained in these samples can then be used to generate reports on system-level and application-level performance.
O프로파일을 사용 할 때에 다음 제한을 숙지하세요:
-
Use of shared libraries — Samples for code in shared libraries are not attributed to the particular application unless the
--separate=libraryoption is used. -
Performance monitoring samples are inexact — When a performance monitoring register triggers a sample, the interrupt handling is not precise like a divide by zero exception. Due to the out-of-order execution of instructions by the processor, the sample may be recorded on a nearby instruction.
-
opreport does not associate samples for inline functions properly — opreport uses a simple address range mechanism to determine which function an address is in. Inline function samples are not attributed to the inline function but rather to the function the inline function was inserted into.
-
OProfile accumulates data from multiple runs — OProfile is a system-wide profiler and expects processes to start up and shut down multiple times. Thus, samples from multiple runs accumulate. Use the command opcontrol --reset to clear out the samples from previous runs.
-
Hardware performance counters do not work on guest virtual machines — Because the hardware performance counters are not available on virtual systems, you need to use the
timermode. Enter the command opcontrol --deinit, and then execute modprobe oprofile timer=1 to enable thetimermode. -
Non-CPU-limited performance problems — OProfile is oriented to finding problems with CPU-limited processes. OProfile does not identify processes that are asleep because they are waiting on locks or for some other event to occur (for example an I/O device to finish an operation).
도구 개요
OProfile Commands provides a brief overview of the most commonly used tools provided with the oprofile package.
| Command | 설명 |
|---|---|
ophelp |
Displays available events for the system’s processor along with a brief description of each. |
opimport |
Converts sample database files from a foreign binary format to the native format for the system. Only use this option when analyzing a sample database from a different architecture. |
opannotate |
Creates annotated source for an executable if the application was compiled with debugging symbols. See Using opannotate for details. |
opcontrol |
Configures what data is collected. See Configuring OProfile Using Legacy Mode for details. |
operf |
Recommended tool to be used in place of opcontrol for profiling. See Using operf for details. For differences between operf and opcontrol see operf vs. opcontrol. |
opreport |
Retrieves profile data. See Using opreport for details. |
oprofiled |
Runs as a daemon to periodically write sample data to disk. |
operf 대 opcontrol
There are two mutually exclusive methods for collecting profiling data with OProfile. You can either use the newer and preferred operf or the opcontrol tool.
This is the recommended mode for profiling. The operf tool uses the Linux Performance Events Subsystem, and therefore does not require the oprofile kernel driver. The operf tool allows you to target your profiling more precisely, as a single process or system-wide, and also allows OProfile to co-exist better with other tools using the performance monitoring hardware on your system. Unlike opcontrol, it can be used without the root privileges. However, operf is also capable of system-wide operations with use of the --system-wide option, where root authority is required.
With operf, there is no initial setup needed. You can invoke operf with command-line options to specify your profiling settings. After that, you can run the OProfile post-processing tools described in Analyzing the Data. See Using operf for further information.
This mode consists of the opcontrol shell script, the oprofiled daemon, and several post-processing tools. The opcontrol command is used for configuring, starting, and stopping a profiling session. An OProfile kernel driver, usually built as a kernel module, is used for collecting samples, which are then recorded into sample files by oprofiled. You can use legacy mode only if you have root privileges. In certain cases, such as when you need to sample areas with disabled interrupt request (IRQ), this is a better alternative.
Before OProfile can be run in legacy mode, it must be configured as shown in Configuring OProfile Using Legacy Mode. These settings are then applied when starting OProfile (Starting and Stopping OProfile Using Legacy Mode).
operf 사용하기
operf is the recommended profiling mode that does not require initial setup before starting. All settings are specified as command-line options and there is no separate command to start the profiling process. To stop operf, press Ctrl+C. The typical operf command syntax looks as follows:
operf 옵션 범위 명령 인수
Replace options with the desired command-line options to specify your profiling settings. Full set of options is described in operf(1) manual page. Replace range with one of the following:
--system-wide - this setting allows for global profiling, see Using operf in System-wide Mode
--pid=PID - this is to profile a running application, where PID is the process ID of the process you want to profile.
With command and args, you can define a specific command or application to be profiled, and also the input arguments that this command or application requires. Either command, --pid or --system-wide is required, but these cannot be used simultaneously.
When you invoke operf on a command line without setting the range option, data will be collected for the children processes.
|
시스템-전반에 걸친 방식에서 operf 사용하기
To run operf If you run operf kill -SIGINT operf-PID
When running operf |
커널 지정하기
커널을 모니터 하려면, 다음 명령어를 실행하세요:
operf --vmlinux=vmlinux_path
With this option, you can specify a path to a vmlinux file that matches the running kernel. Kernel samples will be attributed to this binary, allowing post-processing tools to attribute samples to the appropriate kernel symbols. If this option is not specified, all kernel samples will be attributed to a pseudo binary named "no-vmlinux".
Setting Events to Monitor
Most processors contain counters, which are used by OProfile to monitor specific events. As shown in OProfile Processors and Counters, the number of counters available depends on the processor.
The events for each counter can be configured via the command line or with a graphical interface. For more information on the graphical interface, see Graphical Interface. If the counter cannot be set to a specific event, an error message is displayed.
|
Older Processors and operf
Some older processor models are not supported by the underlying Linux Performance Events Subsystem kernel and therefore are not supported by operf. If you receive this message: Your kernel's Performance Events Subsystem does not support your processor type when attempting to use operf, try profiling with opcontrol to see if your processor type may be supported by OProfile’s legacy mode. |
|
Using operf on Virtual Systems
Since hardware performance counters are not available on guest virtual machines, you have to enable timer mode to use operf on virtual systems. To do so, type as opcontrol
modprobe oprofile
|
To set the event for each configurable counter via the command line, use:
operf --events=event1,event2…
Here, pass a comma-separated list of event specifications for profiling. Each event specification is a colon-separated list of attributes in the following form:
event-name:sample-rate:unit-mask:kernel:user
Event Specifications summarizes these options. The last three values are optional, if you omit them, they will be set to their default values. Note that certain events do require a unit mask.
| Specification | Description |
|---|---|
event-name |
The exact symbolic event name taken from ophelp |
sample-rate |
The number of events to wait before sampling again. The smaller the count, the more frequent the samples. For events that do not happen frequently, a lower count may be needed to capture a statistically significant number of event instances. On the other hand, sampling too frequently can overload the system. By default, OProfile uses a time-based event set, which creates a sample every 100,000 clock cycles per processor. |
unit-mask |
Unit masks, which further define the event, are listed in ophelp. You can insert either a hexadecimal value, beginning with "0x", or a string that matches the first word of the unit mask description in ophelp. Definition by name is valid only for unit masks having "extra:" parameters, as shown by the output of ophelp. This type of unit mask cannot be defined with a hexadecimal value. Note that on certain architectures, there can be multiple unit masks with the same hexadecimal value. In that case they have to be specified by their names only. |
kernel |
Specifies whether to profile kernel code (insert |
user |
Specifies whether to profile user-space code (insert |
The events available vary depending on the processor type. When no event specification is given, the default event for the running processor type will be used for profiling. See Default Events for a list of these default events. To determine the events available for profiling, use the ophelp command.
ophelp
Categorization of Samples
The --separate-thread option categorizes samples by thread group ID (tgid) and thread ID (tid). This is useful for seeing per-thread samples in multi-threaded applications. When used in conjunction with the --system-wide option, --separate-thread is also useful for seeing per-process (i.e., per-thread group) samples for the case where multiple processes are executing the same program during a profiling run.
The --separate-cpu option categorizes samples by CPU.
Configuring OProfile Using Legacy Mode
Before OProfile can be run in legacy mode, it must be configured. At a minimum, selecting to monitor the kernel (or selecting not to monitor the kernel) is required. The following sections describe how to use the opcontrol utility to configure OProfile. As the opcontrol commands are executed, the setup options are saved to the /root/.oprofile/daemonrc file.
커널 지정하기
First, configure whether OProfile should monitor the kernel. This is the only configuration option that is required before starting OProfile. All others are optional.
To monitor the kernel, execute the following command as root:
~]# opcontrol --setup --vmlinux=/usr/lib/debug/lib/modules/`uname -r`/vmlinux
|
Install the debuginfo package
In order to monitor the kernel, the debuginfo package which contains the uncompressed kernel must be installed. |
To configure OProfile not to monitor the kernel, execute the following command as root:
~]# opcontrol --setup --no-vmlinux
This command also loads the oprofile kernel module, if it is not already loaded, and creates the /dev/oprofile/ directory, if it does not already exist. See Understanding the /dev/oprofile/ directory for details about this directory.
Setting whether samples should be collected within the kernel only changes what data is collected, not how or where the collected data is stored. To generate different sample files for the kernel and application libraries, see Separating Kernel and User-space Profiles.
Setting Events to Monitor
Most processors contain counters, which are used by OProfile to monitor specific events. As shown in OProfile Processors and Counters, the number of counters available depends on the processor.
| Processor | cpu_type | Number of Counters |
|---|---|---|
AMD64 |
x86-64/hammer |
4 |
AMD Family 10h |
x86-64/family10 |
4 |
AMD Family 11h |
x86-64/family11 |
4 |
AMD Family 12h |
x86-64/family12 |
4 |
AMD Family 14h |
x86-64/family14 |
4 |
AMD Family 15h |
x86-64/family15 |
6 |
Applied Micro X-Gene |
arm/armv8-xgene |
4 |
ARM Cortex A53 |
arm/armv8-ca53 |
6 |
ARM Cortex A57 |
arm/armv8-ca57 |
6 |
IBM eServer System i and IBM eServer System |
timer |
1 |
IBM POWER4 |
ppc64/power4 |
8 |
IBM POWER5 |
ppc64/power5 |
6 |
IBM PowerPC 970 |
ppc64/970 |
8 |
IBM PowerPC 970MP |
ppc64/970MP |
8 |
IBM POWER5+ |
ppc64/power5+ |
6 |
IBM POWER5++ |
ppc64/power5++ |
6 |
IBM POWER56 |
ppc64/power6 |
6 |
IBM POWER7 |
ppc64/power7 |
6 |
IBM POWER8 |
ppc64/power7 |
8 |
IBM S/390 and IBM System |
timer |
1 |
Intel Core i7 |
i386/core_i7 |
4 |
Intel Nehalem microarchitecture |
i386/nehalem |
4 |
Intel Westmere microarchitecture |
i386/westmere |
4 |
Intel Haswell microarchitecture (non-hyper-threaded) |
i386/haswell |
8 |
Intel Haswell microarchitecture (hyper-threaded) |
i386/haswell-ht |
4 |
Intel Ivy Bridge microarchitecture (non-hyper-threaded) |
i386/ivybridge |
8 |
Intel Ivy Bridge microarchitecture (hyper-threaded) |
i386/ivybridge-ht |
4 |
Intel Sandy Bridge microarchitecture (non-hyper-threaded) |
i386/sandybridge |
8 |
Intel Sandy Bridge microarchitecture |
i386/sandybridge-ht |
4 |
Intel Broadwell microarchitecture (non-hyper-threaded) |
i386/broadwell |
8 |
Intel Broadwell microarchitecture (hyper-threaded) |
i386/broadwell-ht |
4 |
Intel Silvermont microarchitecture |
i386/silvermont |
2 |
TIMER_INT |
timer |
1 |
Use OProfile Processors and Counters to determine the number of events that can be monitored simultaneously for your CPU type. If the processor does not have supported performance monitoring hardware, the timer is used as the processor type.
If timer is used, events cannot be set for any processor because the hardware does not have support for hardware performance counters. Instead, the timer interrupt is used for profiling.
If timer is not used as the processor type, the events monitored can be changed, and counter 0 for the processor is set to a time-based event by default. If more than one counter exists on the processor, the counters other than 0 are not set to an event by default. The default events monitored are shown in Default Events.
| Processor | Default Event for Counter | Description |
|---|---|---|
AMD Athlon and AMD64 |
CPU_CLK_UNHALTED |
The processor’s clock is not halted |
AMD Family 10h, AMD Family 11h, AMD Family 12h |
CPU_CLK_UNHALTED |
The processor’s clock is not halted |
AMD Family 14h, AMD Family 15h |
CPU_CLK_UNHALTED |
The processor’s clock is not halted |
Applied Micro X-Gene |
CPU_CYCLES |
Processor Cycles |
ARM Cortex A53 |
CPU_CYCLES |
Processor Cycles |
ARM Cortex A57 |
CPU_CYCLES |
Processor Cycles |
IBM POWER4 |
CYCLES |
Processor Cycles |
IBM POWER5 |
CYCLES |
Processor Cycles |
IBM POWER8 |
CYCLES |
Processor Cycles |
IBM PowerPC 970 |
CYCLES |
Processor Cycles |
Intel Core i7 |
CPU_CLK_UNHALTED |
The processor’s clock is not halted |
Intel Nehalem microarchitecture |
CPU_CLK_UNHALTED |
The processor’s clock is not halted |
Intel Pentium 4 (hyper-threaded and non-hyper-threaded) |
GLOBAL_POWER_EVENTS |
The time during which the processor is not stopped |
Intel Westmere microarchitecture |
CPU_CLK_UNHALTED |
The processor’s clock is not halted |
Intel Broadwell microarchitecture |
CPU_CLK_UNHALTED |
The processor’s clock is not halted |
Intel Silvermont microarchitecture |
CPU_CLK_UNHALTED |
The processor’s clock is not halted |
TIMER_INT |
(none) |
Sample for each timer interrupt |
The number of events that can be monitored at one time is determined by the number of counters for the processor. However, it is not a one-to-one correlation; on some processors, certain events must be mapped to specific counters. To determine the number of counters available, execute the following command:
~]# ls -d /dev/oprofile/[0-9]*
The events available vary depending on the processor type. To determine the events available for profiling, execute the following command as root (the list is specific to the system’s processor type):
~]# ophelp
|
Make sure that OProfile is configured
Unless OProfile is properly configured, ophelp fails with the following error message: Unable to open cpu_type file for reading Make sure you have done opcontrol --init cpu_type 'unset' is not valid you should upgrade oprofile or force the use of timer mode To configure OProfile, follow the instructions in Configuring OProfile Using Legacy Mode. |
The events for each counter can be configured via the command line or with a graphical interface. For more information on the graphical interface, see Graphical Interface. If the counter cannot be set to a specific event, an error message is displayed.
To set the event for each configurable counter via the command line, use opcontrol:
~]# opcontrol --event=event-name:sample-rate
Replace event-name with the exact name of the event from ophelp, and replace sample-rate with the number of events between samples.
Sampling Rate By default, a time-based event set is selected. It creates a sample every 100,000 clock cycles per processor. If the timer interrupt is used, the timer is set to the respective rate and is not user-settable. If the cpu_type is not timer, each event can have a sampling rate set for it. The sampling rate is the number of events between each sample snapshot.
When setting the event for the counter, a sample rate can also be specified:
~]# opcontrol --event=event-name:sample-rate
Replace sample-rate with the number of events to wait before sampling again. The smaller the count, the more frequent the samples. For events that do not happen frequently, a lower count may be needed to capture the event instances.
|
Sampling too frequently can overload the system
Be extremely careful when setting sampling rates. Sampling too frequently can overload the system, causing the system to appear frozen or causing the system to actually freeze. |
Unit Masks Some user performance monitoring events may also require unit masks to further define the event.
Unit masks for each event are listed with the ophelp command. The values for each unit mask are listed in hexadecimal format. To specify more than one unit mask, the hexadecimal values must be combined using a bitwise or operation.
~]# opcontrol --event=event-name:sample-rate:unit-mask
Note that on certain architectures, there can be multiple unit masks with the same hexadecimal value. In that case they have to be specified by their names only.
Separating Kernel and User-space Profiles
By default, kernel mode and user mode information is gathered for each event. To configure OProfile to ignore events in kernel mode for a specific counter, execute the following command:
~]# opcontrol --event=event-name:sample-rate:unit-mask:0
Execute the following command to start profiling kernel mode for the counter again:
~]# opcontrol --event=event-name:sample-rate:unit-mask:1
To configure OProfile to ignore events in user mode for a specific counter, execute the following command:
~]# opcontrol --event=event-name:sample-rate:unit-mask:1:0
Execute the following command to start profiling user mode for the counter again:
~]# opcontrol --event=event-name:sample-rate:unit-mask:1:1
When the OProfile daemon writes the profile data to sample files, it can separate the kernel and library profile data into separate sample files. To configure how the daemon writes to sample files, execute the following command as root:
~]# opcontrol --separate=choice
The choice argument can be one of the following:
-
none— Do not separate the profiles (default). -
library — Generate per-application profiles for libraries.
-
kernel — Generate per-application profiles for the kernel and kernel modules.
-
all — Generate per-application profiles for libraries and per-application profiles for the kernel and kernel modules.
If --separate=library is used, the sample file name includes the name of the executable as well as the name of the library.
|
Restart the OProfile profiler
These configuration changes will take effect when the OProfile profiler is restarted. |
Starting and Stopping OProfile Using Legacy Mode
To start monitoring the system with OProfile, execute the following command as root:
~]# opcontrol --start
Output similar to the following is displayed:
Using log file /var/lib/oprofile/oprofiled.log Daemon started. Profiler running.
The settings in /root/.oprofile/daemonrc are used. The OProfile daemon, oprofiled, is started; it periodically writes the sample data to the /var/lib/oprofile/samples/ directory. The log file for the daemon is located at /var/lib/oprofile/oprofiled.log.
|
Disable the nmi_watchdog registers
On a Fedora 27 system, the To resolve this, either boot with the nmi_watchdog=0 kernel parameter set, or run the following command as ~]# echo 0 > /proc/sys/kernel/nmi_watchdog To re-enable ~]# echo 1 > /proc/sys/kernel/nmi_watchdog |
To stop the profiler, execute the following command as root:
~]# opcontrol --shutdown
Saving Data in Legacy Mode
Sometimes it is useful to save samples at a specific time. For example, when profiling an executable, it may be useful to gather different samples based on different input data sets. If the number of events to be monitored exceeds the number of counters available for the processor, multiple runs of OProfile can be used to collect data, saving the sample data to different files each time.
To save the current set of sample files, execute the following command, replacing name with a unique descriptive name for the current session:
~]# opcontrol --save=name
The command creates the directory /var/lib/oprofile/samples/name/ and the current sample files are copied to it.
To specify the session directory to hold the sample data, use the --session-dir option. If not specified, the data is saved in the oprofile_data/ directory on the current path.
Analyzing the Data
The same OProfile post-processing tools are used whether you collect your profile with operf or opcontrol in legacy mode.
By default, operf stores the profiling data in the current_dir/oprofile_data/ directory. You can change to a different location with the --session-dir option. The usual post-profiling analysis tools such as opreport and opannotate can be used to generate profile reports. These tools search for samples in current_dir/oprofile_data/ first. If this directory does not exist, the analysis tools use the standard session directory of /var/lib/oprofile/. Statistics, such as total samples received and lost samples, are written to the session_dir/samples/operf.log file.
When using legacy mode, the OProfile daemon, oprofiled, periodically collects the samples and writes them to the /var/lib/oprofile/samples/ directory. Before reading the data, make sure all data has been written to this directory by executing the following command as root:
~]# opcontrol --dump
Each sample file name is based on the name of the executable. For example, the samples for the default event on a Pentium III processor for /bin/bash becomes:
\{root\}/bin/bash/\{dep\}/\{root\}/bin/bash/CPU_CLK_UNHALTED.100000
The following tools are available to profile the sample data once it has been collected:
-
opreport
-
opannotate
Use these tools, along with the binaries profiled, to generate reports that can be further analyzed.
|
Back up the executable and the sample files
The executable being profiled must be used with these tools to analyze the data. If it must change after the data is collected, back up the executable used to create the samples as well as the sample files. Note that the names of the sample file and the binary have to agree. You cannot make a backup if these names do not match. As an alternative, oparchive can be used to address this problem. |
Samples for each executable are written to a single sample file. Samples from each dynamically linked library are also written to a single sample file. While OProfile is running, if the executable being monitored changes and a sample file for the executable exists, the existing sample file is automatically deleted. Thus, if the existing sample file is needed, it must be backed up, along with the executable used to create it before replacing the executable with a new version. The OProfile analysis tools use the executable file that created the samples during analysis. If the executable changes, the analysis tools will be unable to analyze the associated samples. See Saving Data in Legacy Mode for details on how to back up the sample file.
Using opreport
The opreport tool provides an overview of all the executables being profiled. The following is part of a sample output from the opreport command:
~]$ opreport
Profiling through timer interrupt
TIMER:0|
samples|      %|
------------------
25926 97.5212 no-vmlinux 359 1.3504 pi 65 0.2445 Xorg 62 0.2332 libvte.so.4.4.0 56 0.2106 libc-2.3.4.so 34 0.1279 libglib-2.0.so.0.400.7 19 0.0715 libXft.so.2.1.2 17 0.0639 bash 8 0.0301 ld-2.3.4.so 8 0.0301 libgdk-x11-2.0.so.0.400.13 6 0.0226 libgobject-2.0.so.0.400.7 5 0.0188 oprofiled 4 0.0150 libpthread-2.3.4.so 4 0.0150 libgtk-x11-2.0.so.0.400.13 3 0.0113 libXrender.so.1.2.2 3 0.0113 du 1 0.0038 libcrypto.so.0.9.7a 1 0.0038 libpam.so.0.77 1 0.0038 libtermcap.so.2.0.8 1 0.0038 libX11.so.6.2 1 0.0038 libgthread-2.0.so.0.400.7 1 0.0038 libwnck-1.so.4.9.0
Each executable is listed on its own line. The first column is the number of samples recorded for the executable. The second column is the percentage of samples relative to the total number of samples. The third column is the name of the executable.
See the opreport(1) manual page for a list of available command-line options, such as the -r option used to sort the output from the executable with the smallest number of samples to the one with the largest number of samples. You can also use the -t or --threshold option to trim the output of opcontrol.
Using opreport on a Single Executable
To retrieve more detailed profiled information about a specific executable, use the opreport command:
~]# opreport mode
          executable
Replace executable with the full path to the executable to be analyzed. mode stands for one of the following options:
-l-
This option is used to list sample data by symbols. For example, running this command:
~]# opreport -l /lib/tls/libc-version.so
produces the following output:
samples % symbol name 12 21.4286 __gconv_transform_utf8_internal 5 8.9286 _int_malloc 4 7.1429 malloc 3 5.3571 __i686.get_pc_thunk.bx 3 5.3571 _dl_mcount_wrapper_check 3 5.3571 mbrtowc 3 5.3571 memcpy 2 3.5714 _int_realloc 2 3.5714 _nl_intern_locale_data 2 3.5714 free 2 3.5714 strcmp 1 1.7857 __ctype_get_mb_cur_max 1 1.7857 __unregister_atfork 1 1.7857 __write_nocancel 1 1.7857 _dl_addr 1 1.7857 _int_free 1 1.7857 _itoa_word 1 1.7857 calc_eclosure_iter 1 1.7857 fopen@@GLIBC_2.1 1 1.7857 getpid 1 1.7857 memmove 1 1.7857 msort_with_tmp 1 1.7857 strcpy 1 1.7857 strlen 1 1.7857 vfprintf 1 1.7857 write
The first column is the number of samples for the symbol, the second column is the percentage of samples for this symbol relative to the overall samples for the executable, and the third column is the symbol name.
To sort the output from the largest number of samples to the smallest (reverse order), use
-rin conjunction with the-loption. -i symbol-name-
List sample data specific to a symbol name. For example, running:
~]# opreport -l -i __gconv_transform_utf8_internal /lib/tls/libc-version.so
returns the following output:
samples % symbol name 12 100.000 __gconv_transform_utf8_internal
The first line is a summary for the symbol/executable combination.
The first column is the number of samples for the memory symbol. The second column is the percentage of samples for the memory address relative to the total number of samples for the symbol. The third column is the symbol name.
-d-
This option lists sample data by symbols with more detail than the
-loption. For example, with the following command:~]# opreport -d -i __gconv_transform_utf8_internal /lib/tls/libc-version.so
this output is returned:
vma samples % symbol name 00a98640 12 100.000 __gconv_transform_utf8_internal 00a98640 1 8.3333 00a9868c 2 16.6667 00a9869a 1 8.3333 00a986c1 1 8.3333 00a98720 1 8.3333 00a98749 1 8.3333 00a98753 1 8.3333 00a98789 1 8.3333 00a98864 1 8.3333 00a98869 1 8.3333 00a98b08 1 8.3333
The data is the same as the
-loption except that for each symbol, each virtual memory address used is shown. For each virtual memory address, the number of samples and percentage of samples relative to the number of samples for the symbol is displayed. -esymbol-name…-
With this option, you can exclude some symbols from the output. Replace symbol-name with the comma-separated list of symbols you want to exclude.
session:name-
Here, you can specify the full path to the session, a directory relative to the
/var/lib/oprofile/samples/directory, or if you are using operf, a directory relative to./oprofile_data/samples/.
Getting More Detailed Output on the Modules
OProfile collects data on a system-wide basis for kernel- and user-space code running on the machine. However, once a module is loaded into the kernel, the information about the origin of the kernel module is lost. The module could come from the initrd file on boot up, the directory with the various kernel modules, or a locally created kernel module. As a result, when OProfile records samples for a module, it just lists the samples for the modules for an executable in the root directory, but this is unlikely to be the place with the actual code for the module. You will need to take some steps to make sure that analysis tools get the proper executable.
To get a more detailed view of the actions of the module, you will need to either have the module "unstripped" (that is installed from a custom build) or have the debuginfo package installed for the kernel.
Find out which kernel is running with the uname -a command, obtain the appropriate debuginfo package and install it on the machine.
Then proceed with clearing out the samples from previous runs with the following command:
~]# opcontrol --reset
To start the monitoring process, for example, on a machine with Westmere processor, run the following command:
~]# opcontrol --setup --vmlinux=/usr/lib/debug/lib/modules/`uname -r`/vmlinux \ --event=CPU_CLK_UNHALTED:500000
Then the detailed information, for instance, for the ext4 module can be obtained with:
~]# opreport /ext4 -l --image-path /lib/modules/`uname -r`/kernel
CPU: Intel Westmere microarchitecture, speed 2.667e+06 MHz (estimated)
Counted CPU_CLK_UNHALTED events (Clock cycles when not halted) with a unit mask of 0x00 (No unit mask) count 500000
warning: could not check that the binary file /lib/modules/2.6.32-191.el6.x86_64/kernel/fs/ext4/ext4.ko has not been modified since the profile was taken. Results may be inaccurate.
samples  %        symbol name
1622      9.8381  ext4_iget
1591      9.6500  ext4_find_entry
1231      7.4665  __ext4_get_inode_loc
783       4.7492  ext4_ext_get_blocks
752       4.5612  ext4_check_dir_entry
644       3.9061  ext4_mark_iloc_dirty
583       3.5361  ext4_get_blocks
583       3.5361  ext4_xattr_get
479       2.9053  ext4_htree_store_dirent
469       2.8447  ext4_get_group_desc
414       2.5111  ext4_dx_find_entry
Using opannotate
The opannotate tool tries to match the samples for particular instructions to the corresponding lines in the source code. The resulting generated files should have the samples for the lines at the left. It also puts in a comment at the beginning of each function listing the total samples for the function.
For this utility to work, the appropriate debuginfo package for the executable must be installed on the system. On Fedora, the debuginfo packages are not automatically installed with the corresponding packages that contain the executable. You have to obtain and install them separately.
The general syntax for opannotate is as follows:
~]# opannotate --search-dirs src-dir --source executable
These command-line options are mandatory. Replace src-dir with a path to the directory containing the source code and specify the executable to be analyzed. See the opannotate(1) manual page for a list of additional command line options.
Understanding the /dev/oprofile/ directory
When using OProfile in legacy mode, the /dev/oprofile/ directory is used to store the file system for OProfile. On the other hand, operf does not require /dev/oprofile/. Use the cat command to display the values of the virtual files in this file system. For example, the following command displays the type of processor OProfile detected:
~]# cat /dev/oprofile/cpu_type
A directory exists in /dev/oprofile/ for each counter. For example, if there are 2 counters, the directories /dev/oprofile/0/ and /dev/oprofile/1/ exist.
Each directory for a counter contains the following files:
-
count— The interval between samples. -
enabled— If 0, the counter is off and no samples are collected for it; if 1, the counter is on and samples are being collected for it. -
event— The event to monitor. -
extra— Used on machines with Nehalem processors to further specify the event to monitor. -
kernel— If 0, samples are not collected for this counter event when the processor is in kernel-space; if 1, samples are collected even if the processor is in kernel-space. -
unit_mask— Defines which unit masks are enabled for the counter. -
user— If 0, samples are not collected for the counter event when the processor is in user-space; if 1, samples are collected even if the processor is in user-space.
The values of these files can be retrieved with the cat command. For example:
~]# cat /dev/oprofile/0/count
Example Usage
While OProfile can be used by developers to analyze application performance, it can also be used by system administrators to perform system analysis. For example:
-
Determine which applications and services are used the most on a system — opreport can be used to determine how much processor time an application or service uses. If the system is used for multiple services but is underperforming, the services consuming the most processor time can be moved to dedicated systems.
-
Determine processor usage — The
CPU_CLK_UNHALTEDevent can be monitored to determine the processor load over a given period of time. This data can then be used to determine if additional processors or a faster processor might improve system performance.
OProfile Support for Java
OProfile allows you to profile dynamically compiled code (also known as "just-in-time" or JIT code) of the Java Virtual Machine (JVM). OProfile in Fedora 27 includes built-in support for the JVM Tools Interface (JVMTI) agent library, which supports Java 1.5 and higher.
Profiling Java Code
To profile JIT code from the Java Virtual Machine with the JVMTI agent, add the following to the JVM startup parameters:
-agentlib:jvmti_oprofile
Where jvmti_oprofile is a path to the OProfile agent. For 64-bit JVM, the path looks as follows:
-agentlib:/usr/lib64/oprofile/libjvmti_oprofile.so
Currently, you can add one command-line option: --debug, which enables debugging mode.
|
Install the oprofile-jit package
The oprofile-jit package must be installed on the system in order to profile JIT code with OProfile. With this package, you gain the capability to show method-level information. |
Depending on the JVM that you are using, you may have to install the debuginfo package for the JVM. For OpenJDK, this package is required, there is no debuginfo package for Oracle JDK. To keep the debug information packages synchronized with their respective non-debug packages, you also need to install the yum-plugin-auto-update-debug-info plug-in. This plug-in searches the debug information repository for corresponding updates.
After successful setup, you can apply the standard profiling and analyzing tools described in previous sections
To learn more about Java support in OProfile, see the OProfile Manual, which is linked from Additional Resources.
Graphical Interface
Some OProfile preferences can be set with a graphical interface. Make sure you have the oprofile-gui package that provides the OProfile GUI installed on your system. To start the interface, execute the oprof_start command as root at a shell prompt.
After changing any of the options, save them by clicking the Save and quit button. The preferences are written to /root/.oprofile/daemonrc, and the application exits. Exiting the application does not stop OProfile from sampling.
On the Setup tab, to set events for the processor counters as discussed in Setting Events to Monitor, select the counter from the pulldown menu and select the event from the list. A brief description of the event appears in the text box below the list. Only events available for the specific counter and the specific architecture are displayed. The interface also displays whether the profiler is running and some brief statistics about it.
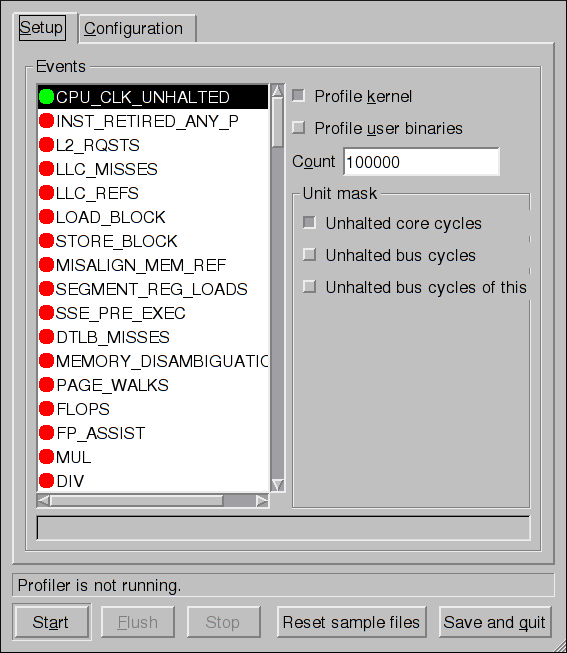
On the right side of the tab, select the Profile kernel option to count events in kernel mode for the currently selected event, as discussed in Separating Kernel and User-space Profiles. If this option is not selected, no samples are collected for the kernel.
Select the Profile user binaries option to count events in user mode for the currently selected event, as discussed in Separating Kernel and User-space Profiles. If this option is not selected, no samples are collected for user applications.
Use the Count text field to set the sampling rate for the currently selected event as discussed in Sampling Rate.
If any unit masks are available for the currently selected event, as discussed in Unit Masks, they are displayed in the Unit Masks area on the right side of the Setup tab. Select the check box beside the unit mask to enable it for the event.
On the Configuration tab, to profile the kernel, enter the name and location of the vmlinux file for the kernel to monitor in the Kernel image file text field. To configure OProfile not to monitor the kernel, select No kernel image.
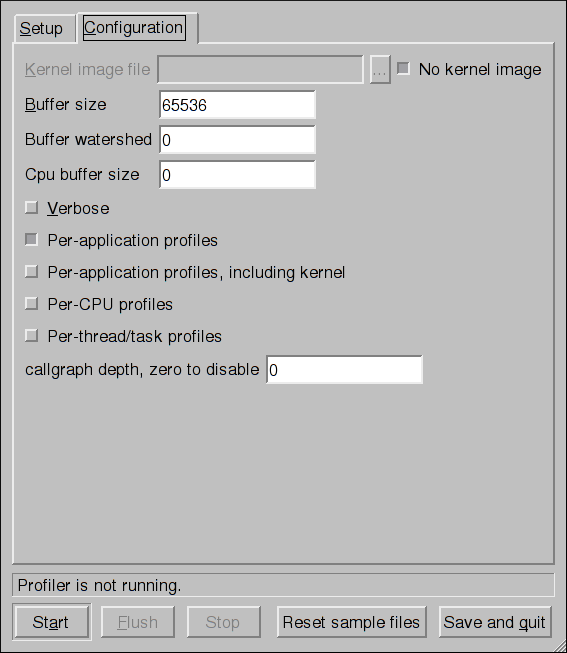
If the Verbose option is selected, the oprofiled daemon log includes more detailed information.
If Per-application profiles is selected, OProfile generates per-application profiles for libraries. This is equivalent to the opcontrol --separate=library command. If Per-application profiles, including kernel is selected, OProfile generates per-application profiles for the kernel and kernel modules as discussed in Separating Kernel and User-space Profiles. This is equivalent to the opcontrol --separate=kernel command.
To force data to be written to samples files as discussed in Analyzing the Data, click the Flush button. This is equivalent to the opcontrol --dump command.
To start OProfile from the graphical interface, click Start. To stop the profiler, click Stop. Exiting the application does not stop OProfile from sampling.
OProfile and SystemTap
SystemTap is a tracing and probing tool that allows users to study and monitor the activities of the operating system in fine detail. It provides information similar to the output of tools like netstat, ps, top, and iostat; however, SystemTap is designed to provide more filtering and analysis options for the collected information.
While using OProfile is suggested in cases of collecting data on where and why the processor spends time in a particular area of code, it is less usable when finding out why the processor stays idle.
You might want to use SystemTap when instrumenting specific places in code. Because SystemTap allows you to run the code instrumentation without having to stop and restart the instrumented code, it is particularly useful for instrumenting the kernel and daemons.
For more information on SystemTap, see Online Documentation for the relevant SystemTap documentation.
추가 자원
To learn more about OProfile and how to configure it, see the following resources.
-
/usr/share/doc/oprofile/oprofile.html— OProfile Manual -
oprofile(1)manual page — Discusses opcontrol, opreport, opannotate, and ophelp -
operf(1)manual page
-
http://oprofile.sourceforge.net/ — Contains the latest upstream documentation, mailing lists, IRC channels, and more.
-
SystemTap Beginners Guide — Provides basic instructions on how to use SystemTap to monitor different subsystems of Fedora in finer detail.
Want to help? Learn how to contribute to Fedora Docs ›