시스템 모니터링 도구
시스템 처리 보기
ps 명령어 사용하기
The ps command allows you to display information about running processes. It produces a static list, that is, a snapshot of what is running when you execute the command. If you want a constantly updated list of running processes, use the top command or the System Monitor application instead.
To list all processes that are currently running on the system including processes owned by other users, type the following at a shell prompt:
ps ax
For each listed process, the ps ax command displays the process ID (PID), the terminal that is associated with it (TTY), the current status (STAT), the cumulated CPU time (TIME), and the name of the executable file (COMMAND). For example:
~]$ ps ax
  PID TTY      STAT   TIME COMMAND
    1 ?        Ss     0:02 /usr/lib/systemd/systemd --system --deserialize 20
    2 ?        S      0:00 [kthreadd]
    3 ?        S      0:00 [ksoftirqd/0]
    5 ?        S      0:00 [kworker/u:0]
    6 ?        S      0:00 [migration/0]
[잘린 출력]
개별 프로세스와 함께 소유자를 표시하려면, 다음 명령을 사용하세요:
ps aux
Apart from the information provided by the ps ax command, ps aux displays the effective username of the process owner (USER), the percentage of the CPU (%CPU) and memory (%MEM) usage, the virtual memory size in kilobytes (VSZ), the non-swapped physical memory size in kilobytes (RSS), and the time or date the process was started. For instance:
~]$ ps aux
USER       PID %CPU %MEM    VSZ   RSS TTY      STAT START   TIME COMMAND
root         1  0.0  0.3  53128  2988 ?        Ss   13:28   0:02 /usr/lib/systemd/systemd --system --deserialize 20
root         2  0.0  0.0      0     0 ?        S    13:28   0:00 [kthreadd]
root         3  0.0  0.0      0     0 ?        S    13:28   0:00 [ksoftirqd/0]
root         5  0.0  0.0      0     0 ?        S    13:28   0:00 [kworker/u:0]
root         6  0.0  0.0      0     0 ?        S    13:28   0:00 [migration/0]
[잘린 출력]
You can also use the ps command in a combination with grep to see if a particular process is running. For example, to determine if Emacs is running, type:
~]$ ps ax | grep emacs
 2625 ?        Sl     0:00 emacs
사용 가능한 명령 줄 선택의 전체 목록은, ps(1) 설명서 부분을 참고하세요.
top 명령 사용하기
The top command displays a real-time list of processes that are running on the system. It also displays additional information about the system uptime, current CPU and memory usage, or total number of running processes, and allows you to perform actions such as sorting the list or killing a process.
top 명령을 실행하려면, 쉡 입력기에서 다음과 같이 입력하세요:
top
For each listed process, the top command displays the process ID (PID), the effective username of the process owner (USER), the priority (PR), the nice value (NI), the amount of virtual memory the process uses (VIRT), the amount of non-swapped physical memory the process uses (RES), the amount of shared memory the process uses (SHR), the percentage of the CPU (%CPU) and memory (%MEM) usage, the cumulated CPU time (TIME+), and the name of the executable file (COMMAND). For example:
~]$ top
top - 19:22:08 up  5:53,  3 users,  load average: 1.08, 1.03, 0.82
Tasks: 117 total,   2 running, 115 sleeping,   0 stopped,   0 zombie
Cpu(s):  9.3%us,  1.3%sy,  0.0%ni, 85.1%id,  0.0%wa,  1.7%hi,  0.0%si,  2.6%st
Mem:    761956k total,   617256k used,   144700k free,    24356k buffers
Swap:  1540092k total,    55780k used,  1484312k free,   256408k cached

  PID USER      PR  NI  VIRT  RES  SHR S %CPU %MEM    TIME+  COMMAND
  510 john      20   0 1435m  99m  18m S  9.0 13.3   3:30.52 gnome-shell
32686 root      20   0  156m  27m 3628 R  2.0  3.7   0:48.69 Xorg
 2625 john      20   0  488m  27m  14m S  0.3  3.7   0:00.70 emacs
    1 root      20   0 53128 2640 1152 S  0.0  0.3   0:02.83 systemd
    2 root      20   0     0    0    0 S  0.0  0.0   0:00.01 kthreadd
    3 root      20   0     0    0    0 S  0.0  0.0   0:00.18 ksoftirqd/0
    5 root      20   0     0    0    0 S  0.0  0.0   0:00.00 kworker/u:0
    6 root      RT   0     0    0    0 S  0.0  0.0   0:00.00 migration/0
    7 root      RT   0     0    0    0 S  0.0  0.0   0:00.30 watchdog/0
    8 root       0 -20     0    0    0 S  0.0  0.0   0:00.00 cpuset
    9 root       0 -20     0    0    0 S  0.0  0.0   0:00.00 khelper
   10 root      20   0     0    0    0 S  0.0  0.0   0:00.00 kdevtmpfs
   11 root       0 -20     0    0    0 S  0.0  0.0   0:00.00 netns
   12 root      20   0     0    0    0 S  0.0  0.0   0:00.11 sync_supers
   13 root      20   0     0    0    0 S  0.0  0.0   0:00.00 bdi-default
   14 root       0 -20     0    0    0 S  0.0  0.0   0:00.00 kintegrityd
   15 root       0 -20     0    0    0 S  0.0  0.0   0:00.00 kblockd
Interactive top commands contains useful interactive commands that you can use with top. For more information, refer to the top(1) manual page.
| 명령 | 설명 |
|---|---|
Enter, Space |
Immediately refreshes the display. |
h, ? |
Displays a help screen. |
k |
Kills a process. You are prompted for the process ID and the signal to send to it. |
n |
Changes the number of displayed processes. You are prompted to enter the number. |
u |
Sorts the list by user. |
M |
Sorts the list by memory usage. |
P |
Sorts the list by CPU usage. |
q |
Terminates the utility and returns to the shell prompt. |
시스템 관리 도구 사용하기
The Processes tab of the System Monitor tool allows you to view, search for, change the priority of, and kill processes from the graphical user interface.
To start the System Monitor tool, either select from the Activities menu, or type gnome-system-monitor at a shell prompt. Then click the Processes tab to view the list of running processes.
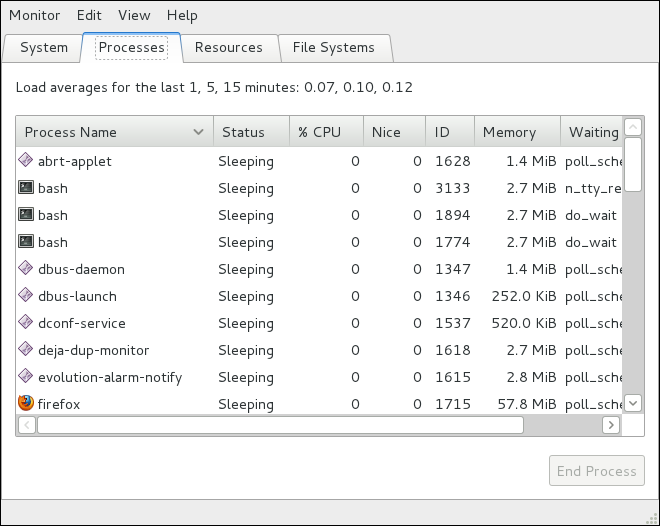
For each listed process, the System Monitor tool displays its name (Process Name), current status (Status), percentage of the memory usage (% CPU), nice value (Nice), process ID (ID), memory usage (Memory), the channel the process is waiting in (Waiting Channel), and additional details about the session (Session). To sort the information by a specific column in ascending order, click the name of that column. Click the name of the column again to toggle the sort between ascending and descending order.
By default, the System Monitor tool displays a list of processes that are owned by the current user. Selecting various options from the View menu allows you to:
-
활성화 프로세서만 보기,
-
모든 프로스세 보기,
-
자신의 프로세서 보기,
-
자신의 프로세서 보기,
-
선택된 프로세서의 메모리 맵 보기,
-
선택된 프로세스에 의해 열린 파일 보기, 그리고
-
프로세서의 목록을 갱신.
추가적으로, 편집 메뉴에서 다양한 옵션을 통해 당신이 다음을 수행 할 수 있도록 합니다:
-
프로세스 멈춤,
-
멈춰진 프로세서를 동작하도록 유지합니다,
-
프로세스 종료,
-
프로세스 죽이기,
-
선택된 프로세스의 우선순위 변경, 그리고
-
edit the System Monitor preferences, such as the refresh interval for the list of processes, or what information to show.
You can also end a process by selecting it from the list and clicking the End Process button.
메모리 사용량 보기
free 명령어 사용하기
The free command allows you to display the amount of free and used memory on the system. To do so, type the following at a shell prompt:
free
The free command provides information about both the physical memory (Mem) and swap space (Swap). It displays the total amount of memory (total), as well as the amount of memory that is in use (used), free (free), shared (shared), in kernel buffers (buffers), and cached (cached). For example:
~]$ free
             합계       사용       여유     공유    버퍼     캐쉬
Mem:        761956     607500     154456          0      37404     156176
-/+ buffers/cache:     413920     348036
Swap:      1540092      84408    1455684
By default, free displays the values in kilobytes. To display the values in megabytes, supply the -m command line option:
free -m
예를 들면:
~]$ free -m
             합계       사용       여유     공유    버퍼     캐쉬
Mem:           744        593        150          0         36        152
-/+ buffers/cache:        404        339
Swap:         1503         82       1421
사용 가능한 명령줄 선택의 전체 목록은, free(1) 설명서 부분을 참고하세요.
시스템 관리 도구 사용하기
The Resources tab of the System Monitor tool allows you to view the amount of free and used memory on the system.
To start the System Monitor tool, either select from the Activities menu, or type gnome-system-monitor at a shell prompt. Then click the Resources tab to view the system’s memory usage.
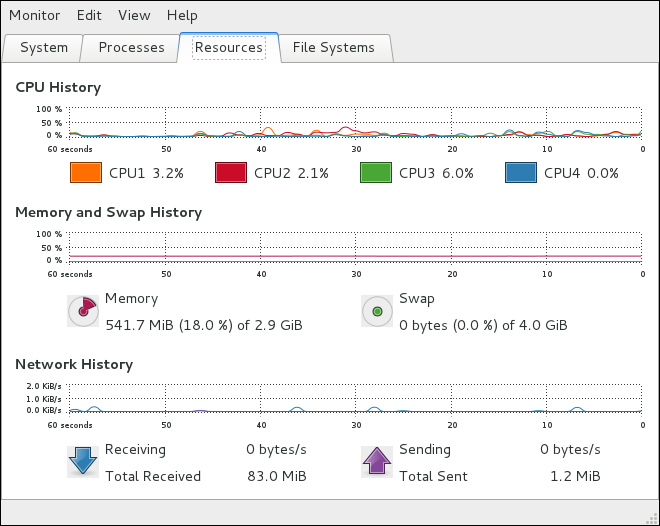
In the Memory and Swap History section, the System Monitor tool displays a graphical representation of the memory and swap usage history, as well as the total amount of the physical memory (Memory) and swap space (Swap) and how much of it is in use.
CPU 사용량 보기
시스템 관리 도구 사용하기
The Resources tab of the System Monitor tool allows you to view the current CPU usage on the system.
To start the System Monitor tool, either select from the Activities menu, or type gnome-system-monitor at a shell prompt. Then click the Resources tab to view the system’s CPU usage.
In the CPU History section, the System Monitor tool displays a graphical representation of the CPU usage history and shows the percentage of how much CPU is currently in use.
블럭 장치와 파일 시스템 보기
lsblk 명령어 사용하기
The lsblk command allows you to display a list of available block devices. To do so, type the following at a shell prompt:
lsblk
For each listed block device, the lsblk command displays the device name (NAME), major and minor device number (MAJ:MIN), if the device is removable (RM), what is its size (SIZE), if the device is read-only (RO), what type is it (TYPE), and where the device is mounted (MOUNTPOINT). For example:
~]$ lsblk
명칭                         MAJ:MIN RM   크기 RO 유형 적재점
sr0                           11:0    1  1024M  0 rom
vda                          252:0    0    20G  0 disk
|-vda1                       252:1    0   500M  0 part /boot
`-vda2                       252:2    0  19.5G  0 part
  |-vg_fedora-lv_swap (dm-0) 253:0    0   1.5G  0 lvm  [SWAP]
  `-vg_fedora-lv_root (dm-1) 253:1    0    18G  0 lvm  /
By default, lsblk lists block devices in a tree-like format. To display the information as an ordinary list, add the -l command line option:
lsblk -l
예를 들면:
~]$ lsblk -l
명칭                     MAJ:MIN RM   크기 RO 유형 적재점
sr0                       11:0    1  1024M  0 rom
vda                      252:0    0    20G  0 disk
vda1                     252:1    0   500M  0 part /boot
vda2                     252:2    0  19.5G  0 part
vg_fedora-lv_swap (dm-0) 253:0    0   1.5G  0 lvm  [SWAP]
vg_fedora-lv_root (dm-1) 253:1    0    18G  0 lvm  /
사용 가능한 명령줄 선택의 전체 항목은, lsblk(8) 설명서 부분을 참고하세요.
lsblk 명령어 사용하기
The blkid command allows you to display information about available block devices. To do so, type the following at a shell prompt as root:
blkid
For each listed block device, the blkid command displays available attributes such as its universally unique identifier (UUID), file system type (TYPE), or volume label (LABEL). For example:
~]# blkid
/dev/vda1: UUID="4ea24c68-ab10-47d4-8a6b-b8d3a002acba" TYPE="ext4"
/dev/vda2: UUID="iJ9YwJ-leFf-A1zb-VVaK-H9t1-raLW-HoqlUG" TYPE="LVM2_member"
/dev/mapper/vg_fedora-lv_swap: UUID="d6d755bc-3e3e-4e8f-9bb5-a5e7f4d86ffd" TYPE="swap"
/dev/mapper/vg_fedora-lv_root: LABEL="_Fedora-17-x86_6" UUID="77ba9149-751a-48e0-974f-ad94911734b9" TYPE="ext4"
By default, the lsblk command lists all available block devices. To display information about a particular device only, specify the device name on the command line:
blkid 장치_이름
예를 들면, `/dev/vda1`에 대하여 정보를 표시하려면, 다음을 입력하세요:
~]# blkid /dev/vda1
/dev/vda1: UUID="4ea24c68-ab10-47d4-8a6b-b8d3a002acba" TYPE="ext4"
You can also use the above command with the -p and -o udev command line options to obtain more detailed information. Note that root privileges are required to run this command:
blkid -po udev 장치_이름
예를 들어:
~]# blkid -po udev /dev/vda1
ID_FS_UUID=4ea24c68-ab10-47d4-8a6b-b8d3a002acba
ID_FS_UUID_ENC=4ea24c68-ab10-47d4-8a6b-b8d3a002acba
ID_FS_VERSION=1.0
ID_FS_TYPE=ext4
ID_FS_USAGE=filesystem
ID_PART_ENTRY_SCHEME=dos
ID_PART_ENTRY_TYPE=0x83
ID_PART_ENTRY_FLAGS=0x80
ID_PART_ENTRY_NUMBER=1
ID_PART_ENTRY_OFFSET=2048
ID_PART_ENTRY_SIZE=1024000
ID_PART_ENTRY_DISK=252:0
사용 가능한 명령줄 선택의 전체 항목은, blkid(8) 설명서 부분을 참고하세요.
partx 명령어 사용하기
The partx command allows you to display a list of disk partitions. To list the partition table of a particular disk, as root, run this command with the -s option followed by the device name:
partx -s 장치_이름
예를 들면, `/dev/vda`에서 파티션을 나열하려면, 다음과 같이 입력하세요:
~]# partx -s /dev/vda
번호   시작      끝  섹터  크기 이름 UUID
 1    2048  1026047  1024000  500M
 2 1026048 41943039 40916992 19.5G
사용 가능한 명령줄 선택의 전체 목록은, partx(8) 설명서 부분을 참고하세요.
findmnt 명령 사용하기
The findmnt command allows you to display a list of currently mounted file systems. To do so, type the following at a shell prompt:
findmnt
For each listed file system, the findmnt command displays the target mount point (TARGET), source device (SOURCE), file system type (FSTYPE), and relevant mount options (OPTIONS). For example:
~]$ findmnt
TARGET                           SOURCE     FSTYPE   OPTIONS
/                                /dev/mapper/vg_fedora-lv_root
                                            ext4     rw,relatime,seclabel,data=o
|-/proc                          proc       proc     rw,nosuid,nodev,noexec,rela
| `-/proc/sys/fs/binfmt_misc     systemd-1  autofs   rw,relatime,fd=23,pgrp=1,ti
|-/sys                           sysfs      sysfs    rw,nosuid,nodev,noexec,rela
| |-/sys/kernel/security         securityfs security rw,nosuid,nodev,noexec,rela
| |-/sys/fs/selinux              selinuxfs  selinuxf rw,relatime
| |-/sys/fs/cgroup               tmpfs      tmpfs    rw,nosuid,nodev,noexec,secl
| | |-/sys/fs/cgroup/systemd     cgroup     cgroup   rw,nosuid,nodev,noexec,rela
| | |-/sys/fs/cgroup/cpuset      cgroup     cgroup   rw,nosuid,nodev,noexec,rela
| | |-/sys/fs/cgroup/cpu,cpuacct cgroup     cgroup   rw,nosuid,nodev,noexec,rela
| | |-/sys/fs/cgroup/memory      cgroup     cgroup   rw,nosuid,nodev,noexec,rela
| | |-/sys/fs/cgroup/devices     cgroup     cgroup   rw,nosuid,nodev,noexec,rela
| | |-/sys/fs/cgroup/freezer     cgroup     cgroup   rw,nosuid,nodev,noexec,rela
| | |-/sys/fs/cgroup/net_cls     cgroup     cgroup   rw,nosuid,nodev,noexec,rela
| | |-/sys/fs/cgroup/blkio       cgroup     cgroup   rw,nosuid,nodev,noexec,rela
| | `-/sys/fs/cgroup/perf_event  cgroup     cgroup   rw,nosuid,nodev,noexec,rela
| |-/sys/kernel/debug            debugfs    debugfs  rw,relatime
| `-/sys/kernel/config           configfs   configfs rw,relatime
[잘린 출력]
By default, findmnt lists file systems in a tree-like format. To display the information as an ordinary list, add the -l command line option:
findmnt -l
예를 들면:
~]$ findmnt -l
TARGET                     SOURCE     FSTYPE   OPTIONS
/proc                      proc       proc     rw,nosuid,nodev,noexec,relatime
/sys                       sysfs      sysfs    rw,nosuid,nodev,noexec,relatime,s
/dev                       devtmpfs   devtmpfs rw,nosuid,seclabel,size=370080k,n
/dev/pts                   devpts     devpts   rw,nosuid,noexec,relatime,seclabe
/dev/shm                   tmpfs      tmpfs    rw,nosuid,nodev,seclabel
/run                       tmpfs      tmpfs    rw,nosuid,nodev,seclabel,mode=755
/                          /dev/mapper/vg_fedora-lv_root
                                      ext4     rw,relatime,seclabel,data=ordered
/sys/kernel/security       securityfs security rw,nosuid,nodev,noexec,relatime
/sys/fs/selinux            selinuxfs  selinuxf rw,relatime
/sys/fs/cgroup             tmpfs      tmpfs    rw,nosuid,nodev,noexec,seclabel,m
/sys/fs/cgroup/systemd     cgroup     cgroup   rw,nosuid,nodev,noexec,relatime,r
[잘린 출력]
You can also choose to list only file systems of a particular type. To do so, add the -t command line option followed by a file system type:
findmnt -t 유형
예를 들면, 모든 ext4 파일 시스템 목록에, 다음과 같이 입력하세요:
~]$ findmnt -t ext4
대상 원천                        파일시스템유형 옵션
/      /dev/mapper/vg_fedora-lv_root ext4   rw,relatime,seclabel,data=ordered
/boot  /dev/vda1                     ext4   rw,relatime,seclabel,data=ordered
사용 가능한 명령줄 선택의 전체 항목은, findmnt(8) 설명서 부분을 참고하세요.
df 명령어 사용하기
The df command allows you to display a detailed report on the system’s disk space usage. To do so, type the following at a shell prompt:
df
For each listed file system, the df command displays its name (Filesystem), size (1K-blocks or Size), how much space is used (Used), how much space is still available (Available), the percentage of space usage (Use%), and where is the file system mounted (Mounted on). For example:
~]$ df
파일시스템                    1K-블록    사용 가용 사용% 적재위치
rootfs                         18877356 4605476  14082844  25% /
devtmpfs                         370080       0    370080   0% /dev
tmpfs                            380976     256    380720   1% /dev/shm
tmpfs                            380976    3048    377928   1% /run
/dev/mapper/vg_fedora-lv_root  18877356 4605476  14082844  25% /
tmpfs                            380976       0    380976   0% /sys/fs/cgroup
tmpfs                            380976       0    380976   0% /media
/dev/vda1                        508745   85018    398127  18% /boot
By default, the df command shows the partition size in 1 kilobyte blocks and the amount of used and available disk space in kilobytes. To view the information in megabytes and gigabytes, supply the -h command line option, which causes df to display the values in a human-readable format:
df -h
예를 들면:
~]$ df -h
파일시스템                     크기  사용 가용 사용% 적재위치
rootfs                          19G  4.4G   14G  25% /
devtmpfs                       362M     0  362M   0% /dev
tmpfs                          373M  256K  372M   1% /dev/shm
tmpfs                          373M  3.0M  370M   1% /run
/dev/mapper/vg_fedora-lv_root   19G  4.4G   14G  25% /
tmpfs                          373M     0  373M   0% /sys/fs/cgroup
tmpfs                          373M     0  373M   0% /media
/dev/vda1                      497M   84M  389M  18% /boot
Note that the /dev/shm entry represents the system’s virtual memory file system, /sys/fs/cgroup is a cgroup file system, and /run contains information about the running system.
사용 가능한 명령줄 선택의 전체 항목은, df(1) 설명서 부분을 참고하세요.
du 명령어 사용하기
The du command allows you to displays the amount of space that is being used by files in a directory. To display the disk usage for each of the subdirectories in the current working directory, run the command with no additional command line options:
du
예를 들어:
~]$ du
8       ./.gconf/apps/gnome-terminal/profiles/Default
12      ./.gconf/apps/gnome-terminal/profiles
16      ./.gconf/apps/gnome-terminal
[잘린 출력]
460     ./.gimp-2.6
68828   .
By default, the du command displays the disk usage in kilobytes. To view the information in megabytes and gigabytes, supply the -h command line option, which causes the utility to display the values in a human-readable format:
du -h
예를 들면:
~]$ du -h
8.0K    ./.gconf/apps/gnome-terminal/profiles/Default
12K     ./.gconf/apps/gnome-terminal/profiles
16K     ./.gconf/apps/gnome-terminal
[잘린 출력]
460K    ./.gimp-2.6
68M     .
At the end of the list, the du command always shows the grand total for the current directory. To display only this information, supply the -s command line option:
du -sh
예를 들어:
~]$ du -sh
68M     .
사용 가능한 명령줄 옵션의 전체 목록을 위해, du(1) 설명서 부분을 참고하세요.
시스템 관리 도구 사용하기
The File Systems tab of the System Monitor tool allows you to view file systems and disk space usage in the graphical user interface.
To start the System Monitor tool, either select from the Activities menu, or type gnome-system-monitor at a shell prompt. Then click the File Systems tab to view a list of file systems.
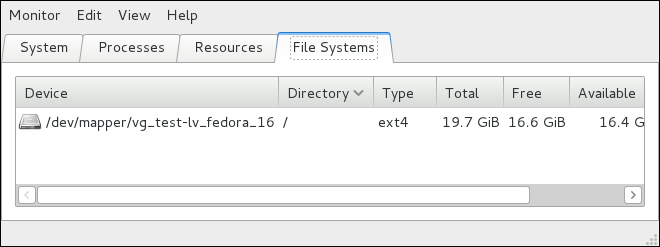
For each listed file system, the System Monitor tool displays the source device (Device), target mount point (Directory), and file system type (Type), as well as its size (Total) and how much space is free (Free), available (Available), and used (Used).
하드웨어 정보 보기
lspci 명령어 사용하기
The lspci command lists all PCI devices that are present in the system:
lspci
예를 들어:
~]$ lspci
00:00.0 Host bridge: Intel Corporation 82X38/X48 Express DRAM Controller
00:01.0 PCI bridge: Intel Corporation 82X38/X48 Express Host-Primary PCI Express Bridge
00:1a.0 USB Controller: Intel Corporation 82801I (ICH9 Family) USB UHCI Controller #4 (rev 02)
00:1a.1 USB Controller: Intel Corporation 82801I (ICH9 Family) USB UHCI Controller #5 (rev 02)
00:1a.2 USB Controller: Intel Corporation 82801I (ICH9 Family) USB UHCI Controller #6 (rev 02)
[output truncated]
You can also use the -v command line option to display more verbose output, or -vv for very verbose output:
lspci-v|-vv
For instance, to determine the manufacturer, model, and memory size of a system’s video card, type:
~]$ lspci -v
[output truncated]

01:00.0 VGA compatible controller: nVidia Corporation G84 [Quadro FX 370] (rev a1) (prog-if 00 [VGA controller])
        Subsystem: nVidia Corporation Device 0491
        Physical Slot: 2
        Flags: bus master, fast devsel, latency 0, IRQ 16
        Memory at f2000000 (32-bit, non-prefetchable) [size=16M]
        Memory at e0000000 (64-bit, prefetchable) [size=256M]
        Memory at f0000000 (64-bit, non-prefetchable) [size=32M]
        I/O ports at 1100 [size=128]
        Expansion ROM at <unassigned> [disabled]
        Capabilities: <access denied>
        Kernel driver in use: nouveau
        Kernel modules: nouveau, nvidiafb

[잘린 출력]
사용 가능한 명령 줄 선택의 전체 목록은, lspci(8) 설명서 부분을 참고하세요.
lsusb 명령어 사용하기
The lsusb command allows you to display information about USB buses and devices that are attached to them. To list all USB devices that are in the system, type the following at a shell prompt:
lsusb
이는 다음과 같이 간단한 장치 목록이 표시됩니다:
~]$ lsusb
Bus 001 Device 001: ID 1d6b:0002 Linux Foundation 2.0 root hub
Bus 002 Device 001: ID 1d6b:0002 Linux Foundation 2.0 root hub
[output truncated]
Bus 001 Device 002: ID 0bda:0151 Realtek Semiconductor Corp. Mass Storage Device (Multicard Reader)
Bus 008 Device 002: ID 03f0:2c24 Hewlett-Packard Logitech M-UAL-96 Mouse
Bus 008 Device 003: ID 04b3:3025 IBM Corp.
You can also use the -v command line option to display more verbose output:
lsusb -v
예를 들면:
~]$ lsusb -v
[output truncated]

Bus 008 Device 002: ID 03f0:2c24 Hewlett-Packard Logitech M-UAL-96 Mouse
Device Descriptor:
  bLength                18
  bDescriptorType         1
  bcdUSB               2.00
  bDeviceClass            0 (Defined at Interface level)
  bDeviceSubClass         0
  bDeviceProtocol         0
  bMaxPacketSize0         8
  idVendor           0x03f0 Hewlett-Packard
  idProduct          0x2c24 Logitech M-UAL-96 Mouse
  bcdDevice           31.00
  iManufacturer           1
  iProduct                2
  iSerial                 0
  bNumConfigurations      1
  Configuration Descriptor:
    bLength                 9
    bDescriptorType         2
[output truncated]
사용 가능한 명령줄 선택의 전체 목록을 위해, lsusb(8) 설명서 부분을 참고하세요.
lspci 명령어 사용하기
The lspcmcia command allows you to list all PCMCIA devices that are present in the system. To do so, type the following at a shell prompt:
lspcmcia
예를 들어:
~]$ lspcmcia
Socket 0 Bridge:        [yenta_cardbus]         (bus ID: 0000:15:00.0)
You can also use the -v command line option to display more verbose information, or -vv to increase the verbosity level even further:
lspcmcia-v|-vv
예를 들면:
~]$ lspcmcia -v
Socket 0 Bridge:        [yenta_cardbus]         (bus ID: 0000:15:00.0)
        Configuration:  state: on       ready: unknown
사용 가능한 명령줄 선택의 전체 목록은, pccardctl(8) 설명서 부분을 참고하세요.
lscpu 명령어 사용하기
The lscpu command allows you to list information about CPUs that are present in the system, including the number of CPUs, their architecture, vendor, family, model, CPU caches, etc. To do so, type the following at a shell prompt:
lscpu
예를 들어:
~]$ lscpu
구조:          x86_64
중앙처리장치 동작-방식:        32-비트, 64-비트
바이트 저장 순서:            리틀 엔디안
중앙처리장치:                4
동작 중인 중앙처리장치 목록:   0-3
코어당 쓰레드:    1
소켓당 코어:    4
소켓:             1
NUMA 노드:          1
제조사 ID:             인텔
중앙처리장치 계열:            6
모델:                 23
스텝핑:              7
중앙처리장치 MHz:               1998.000
커널 타이밍 계산결과:              4999.98
가상화:        VT-x
L1d 캐쉬:             32K
L1i 캐쉬:             32K
L2 캐쉬:              3072K
NUMA 노드0 중앙처리장치:     0-3
사용 가능한 명령줄 옵션의 전체 목록을 위해, lscpu(1) 설명서 부분을 참고하세요.
하드웨어 검침 사용하기
The hw-probe command allows you to list all hardware devices, perform sanity tests for some of them and submit result to the hardware database. To do so, type the following at a shell prompt:
hw-probe -all -upload
예를 들어:
~]$ hw-probe -all -upload
Probe for hardware ... Ok
Reading logs ... Ok
Uploaded to DB, Thank you!
Probe URL: https://linux-hardware.org/?probe=c84b37d646
Net-SNMP로 성능 모니터링
Fedora 30 includes the Net-SNMP software suite, which includes a flexible and extensible Simple Network Management Protocol (SNMP) agent. This agent and its associated utilities can be used to provide performance data from a large number of systems to a variety of tools which support polling over the SNMP protocol.
This section provides information on configuring the Net-SNMP agent to securely provide performance data over the network, retrieving the data using the SNMP protocol, and extending the SNMP agent to provide custom performance metrics.
Net-SNMP 설치하기
The Net-SNMP software suite is available as a set of RPM packages in the Fedora software distribution. Available Net-SNMP packages summarizes each of the packages and their contents.
| Package | Provides |
|---|---|
net-snmp |
The SNMP Agent Daemon and documentation. This package is required for exporting performance data. |
net-snmp-libs |
The |
net-snmp-utils |
SNMP clients such as snmpget and snmpwalk. This package is required in order to query a system’s performance data over SNMP. |
net-snmp-perl |
The mib2c utility and the |
net-snmp-python |
An SNMP client library for Python. |
이들 꾸러미를 설치하려면, 다음 형식에서 dnf 명령을 사용하세요:
dnf install package…
For example, to install the SNMP Agent Daemon and SNMP clients used in the rest of this section, type the following at a shell prompt:
~]# dnf install net-snmp net-snmp-libs net-snmp-utils
Note that you must have superuser privileges (that is, you must be logged in as root) to run this command. For more information on how to install new packages in Fedora, refer to Installing Packages.
Net-SNMP 데몬 동작하기
The net-snmp package contains snmpd, the SNMP Agent Daemon. This section provides information on how to start, stop, and restart the snmpd service, and shows how to enable or disable it in the multi-user target unit. For more information on the concept of target units and how to manage system services in Fedora in general, refer to Services and Daemons.
서비스 시작하기
현재 세션에서 snmpd 서비스를 동작하려면, `root`으로 쉘 입력기에 다음을 입력하세요:
systemctlstartsnmpd.service
To configure the service to be automatically started at boot time, use the following command:
systemctlenablesnmpd.service
이는`multi-user` 대상 단위에서 서비스를 활성화합니다.
서비스 중지
To stop the running snmpd service, type the following at a shell prompt as root:
systemctlstopsnmpd.service
부팅 중에 서비스 시작을 비활성화 하려면, 다음 명령을 사용하세요:
systemctldisablesnmpd.service
이는 multi-user 대상 단위에서 서비스를 비활성화 합니다.
서비스 재시작하기
To restart the running snmpd service, type the following at a shell prompt:
systemctlrestartsnmpd.service
This will stop the service and start it again in quick succession. To only reload the configuration without stopping the service, run the following command instead:
systemctlreloadsnmpd.service
이는 실행 중인`snmpd` 서비스 구성을 다시 적재하는데 발생합니다.
Net-SNMP 구성하기
To change the Net-SNMP Agent Daemon configuration, edit the /etc/snmp/snmpd.conf configuration file. The default snmpd.conf file shipped with Fedora 30 is heavily commented and serves as a good starting point for agent configuration.
This section focuses on two common tasks: setting system information and configuring authentication. For more information about available configuration directives, refer to the snmpd.conf(5) manual page. Additionally, there is a utility in the net-snmp package named snmpconf which can be used to interactively generate a valid agent configuration.
Note that the net-snmp-utils package must be installed in order to use the snmpwalk utility described in this section.
|
변경 적용하기
For any changes to the configuration file to take effect, force the systemctl |
시스템 정보 설정하기
Net-SNMP provides some rudimentary system information via the system tree. For example, the following snmpwalk command shows the system tree with a default agent configuration.
~]# snmpwalk -v2c -c public localhost system
SNMPv2-MIB::sysDescr.0 = STRING: Linux localhost.localdomain 2.6.32-122.el6.x86_64 #1 SMP Wed Mar 9 23:54:34 EST 2011 x86_64
SNMPv2-MIB::sysObjectID.0 = OID: NET-SNMP-MIB::netSnmpAgentOIDs.10
DISMAN-EVENT-MIB::sysUpTimeInstance = Timeticks: (99554) 0:16:35.54
SNMPv2-MIB::sysContact.0 = STRING: Root <root@localhost> (configure /etc/snmp/snmp.local.conf)
SNMPv2-MIB::sysName.0 = STRING: localhost.localdomain
SNMPv2-MIB::sysLocation.0 = STRING: Unknown (edit /etc/snmp/snmpd.conf)
By default, the sysName object is set to the hostname. The sysLocation and sysContact objects can be configured in the /etc/snmp/snmpd.conf file by changing the value of the syslocation and syscontact directives, for example:
syslocation Datacenter, Row 3, Rack 2
syscontact UNIX Admin <admin@example.com>
After making changes to the configuration file, reload the configuration and test it by running the snmpwalk command again:
~]# systemct reload snmpd.service
~]# snmpwalk -v2c -c public localhost system
SNMPv2-MIB::sysDescr.0 = STRING: Linux localhost.localdomain 2.6.32-122.el6.x86_64 #1 SMP Wed Mar 9 23:54:34 EST 2011 x86_64
SNMPv2-MIB::sysObjectID.0 = OID: NET-SNMP-MIB::netSnmpAgentOIDs.10
DISMAN-EVENT-MIB::sysUpTimeInstance = Timeticks: (158357) 0:26:23.57
SNMPv2-MIB::sysContact.0 = STRING: UNIX Admin <admin@example.com>
SNMPv2-MIB::sysName.0 = STRING: localhost.localdomain
SNMPv2-MIB::sysLocation.0 = STRING: Datacenter, Row 3, Rack 2
인증 구성하기
The Net-SNMP Agent Daemon supports all three versions of the SNMP protocol. The first two versions (1 and 2c) provide for simple authentication using a community string. This string is a shared secret between the agent and any client utilities. The string is passed in clear text over the network however and is not considered secure. Version 3 of the SNMP protocol supports user authentication and message encryption using a variety of protocols. The Net-SNMP agent also supports tunneling over SSH, TLS authentication with X.509 certificates, and Kerberos authentication.
To configure an SNMP version 2c community, use either the rocommunity or rwcommunity directive in the /etc/snmp/snmpd.conf configuration file. The format of the directives is the following:
directive community source OID
… where community is the community string to use, source is an IP address or subnet, and OID is the SNMP tree to provide access to. For example, the following directive provides read-only access to the system tree to a client using the community string "redhat" on the local machine:
rocommunity redhat 127.0.0.1 .1.3.6.1.2.1.1
To test the configuration, use the snmpwalk command with the -v and -c options.
~]# snmpwalk -v2c -c redhat localhost system
SNMPv2-MIB::sysDescr.0 = STRING: Linux localhost.localdomain 2.6.32-122.el6.x86_64 #1 SMP Wed Mar 9 23:54:34 EST 2011 x86_64
SNMPv2-MIB::sysObjectID.0 = OID: NET-SNMP-MIB::netSnmpAgentOIDs.10
DISMAN-EVENT-MIB::sysUpTimeInstance = Timeticks: (158357) 0:26:23.57
SNMPv2-MIB::sysContact.0 = STRING: UNIX Admin <admin@example.com>
SNMPv2-MIB::sysName.0 = STRING: localhost.localdomain
SNMPv2-MIB::sysLocation.0 = STRING: Datacenter, Row 3, Rack 2
To configure an SNMP version 3 user, use the net-snmp-create-v3-user command. This command adds entries to the /var/lib/net-snmp/snmpd.conf and /etc/snmp/snmpd.conf files which create the user and grant access to the user. Note that the net-snmp-create-v3-user command may only be run when the agent is not running. The following example creates the "sysadmin" user with the password "redhatsnmp":
~]# systemctl stop snmpd.service
~]# net-snmp-create-v3-user
Enter a SNMPv3 user name to create:
admin
Enter authentication pass-phrase:
redhatsnmp
Enter encryption pass-phrase:
  [press return to reuse the authentication pass-phrase]

adding the following line to /var/lib/net-snmp/snmpd.conf:
   createUser admin MD5 "redhatsnmp" DES
adding the following line to /etc/snmp/snmpd.conf:
   rwuser admin
~]# systemctl start snmpd.service
The rwuser directive (or rouser when the -ro command line option is supplied) that net-snmp-create-v3-user adds to /etc/snmp/snmpd.conf has a similar format to the rwcommunity and rocommunity directives:
directive usernoauth|auth|privOID
… where user is a username and OID is the SNMP tree to provide access to. By default, the Net-SNMP Agent Daemon allows only authenticated requests (the auth option). The noauth option allows you to permit unauthenticated requests, and the priv option enforces the use of encryption. The authpriv option specifies that requests must be authenticated and replies should be encrypted.
For example, the following line grants the user "admin" read-write access to the entire tree:
rwuser admin authpriv .1
To test the configuration, create a .snmp directory in your user’s home directory and a configuration file named snmp.conf in that directory (~/.snmp/snmp.conf) with the following lines:
defVersion 3
defSecurityLevel authPriv
defSecurityName admin
defPassphrase redhatsnmp
The snmpwalk command will now use these authentication settings when querying the agent:
~]$ snmpwalk -v3 localhost system
SNMPv2-MIB::sysDescr.0 = STRING: Linux localhost.localdomain 2.6.32-122.el6.x86_64 #1 SMP Wed Mar 9 23:54:34 EST 2011 x86_64
[output truncated]
SNMP를 통한 성능 자료 검색
The Net-SNMP Agent in Fedora provides a wide variety of performance information over the SNMP protocol. In addition, the agent can be queried for a listing of the installed RPM packages on the system, a listing of currently running processes on the system, or the network configuration of the system.
This section provides an overview of OIDs related to performance tuning available over SNMP. It assumes that the net-snmp-utils package is installed and that the user is granted access to the SNMP tree as described in Configuring Authentication.
하드웨어 구성
The Host Resources MIB included with Net-SNMP presents information about the current hardware and software configuration of a host to a client utility. Available OIDs summarizes the different OIDs available under that MIB.
| OID | Description |
|---|---|
|
Contains general system information such as uptime, number of users, and number of running processes. |
|
Contains data on memory and file system usage. |
|
Contains a listing of all processors, network devices, and file systems. |
|
Contains a listing of all running processes. |
|
Contains memory and CPU statistics on the process table from HOST-RESOURCES-MIB::hrSWRun. |
|
Contains a listing of the RPM database. |
There are also a number of SNMP tables available in the Host Resources MIB which can be used to retrieve a summary of the available information. The following example displays HOST-RESOURCES-MIB::hrFSTable:
~]$ snmptable -Cb localhost HOST-RESOURCES-MIB::hrFSTable
SNMP table: HOST-RESOURCES-MIB::hrFSTable

 Index MountPoint RemoteMountPoint                                Type
    Access Bootable StorageIndex LastFullBackupDate LastPartialBackupDate
     1        "/"               "" HOST-RESOURCES-TYPES::hrFSLinuxExt2
 readWrite     true           31      0-1-1,0:0:0.0         0-1-1,0:0:0.0
     5 "/dev/shm"               ""     HOST-RESOURCES-TYPES::hrFSOther
 readWrite    false           35      0-1-1,0:0:0.0         0-1-1,0:0:0.0
     6    "/boot"               "" HOST-RESOURCES-TYPES::hrFSLinuxExt2
 readWrite    false           36      0-1-1,0:0:0.0         0-1-1,0:0:0.0
For more information about HOST-RESOURCES-MIB, see the /usr/share/snmp/mibs/HOST-RESOURCES-MIB.txt file.
CPU와 메모리 정보
Most system performance data is available in the UCD SNMP MIB. The systemStats OID provides a number of counters around processor usage:
~]$ snmpwalk localhost UCD-SNMP-MIB::systemStats
UCD-SNMP-MIB::ssIndex.0 = INTEGER: 1
UCD-SNMP-MIB::ssErrorName.0 = STRING: systemStats
UCD-SNMP-MIB::ssSwapIn.0 = INTEGER: 0 kB
UCD-SNMP-MIB::ssSwapOut.0 = INTEGER: 0 kB
UCD-SNMP-MIB::ssIOSent.0 = INTEGER: 0 blocks/s
UCD-SNMP-MIB::ssIOReceive.0 = INTEGER: 0 blocks/s
UCD-SNMP-MIB::ssSysInterrupts.0 = INTEGER: 29 interrupts/s
UCD-SNMP-MIB::ssSysContext.0 = INTEGER: 18 switches/s
UCD-SNMP-MIB::ssCpuUser.0 = INTEGER: 0
UCD-SNMP-MIB::ssCpuSystem.0 = INTEGER: 0
UCD-SNMP-MIB::ssCpuIdle.0 = INTEGER: 99
UCD-SNMP-MIB::ssCpuRawUser.0 = Counter32: 2278
UCD-SNMP-MIB::ssCpuRawNice.0 = Counter32: 1395
UCD-SNMP-MIB::ssCpuRawSystem.0 = Counter32: 6826
UCD-SNMP-MIB::ssCpuRawIdle.0 = Counter32: 3383736
UCD-SNMP-MIB::ssCpuRawWait.0 = Counter32: 7629
UCD-SNMP-MIB::ssCpuRawKernel.0 = Counter32: 0
UCD-SNMP-MIB::ssCpuRawInterrupt.0 = Counter32: 434
UCD-SNMP-MIB::ssIORawSent.0 = Counter32: 266770
UCD-SNMP-MIB::ssIORawReceived.0 = Counter32: 427302
UCD-SNMP-MIB::ssRawInterrupts.0 = Counter32: 743442
UCD-SNMP-MIB::ssRawContexts.0 = Counter32: 718557
UCD-SNMP-MIB::ssCpuRawSoftIRQ.0 = Counter32: 128
UCD-SNMP-MIB::ssRawSwapIn.0 = Counter32: 0
UCD-SNMP-MIB::ssRawSwapOut.0 = Counter32: 0
In particular, the ssCpuRawUser, ssCpuRawSystem, ssCpuRawWait, and ssCpuRawIdle OIDs provide counters which are helpful when determining whether a system is spending most of its processor time in kernel space, user space, or I/O. ssRawSwapIn and ssRawSwapOut can be helpful when determining whether a system is suffering from memory exhaustion.
More memory information is available under the UCD-SNMP-MIB::memory OID, which provides similar data to the free command:
~]$ snmpwalk localhost UCD-SNMP-MIB::memory
UCD-SNMP-MIB::memIndex.0 = INTEGER: 0
UCD-SNMP-MIB::memErrorName.0 = STRING: swap
UCD-SNMP-MIB::memTotalSwap.0 = INTEGER: 1023992 kB
UCD-SNMP-MIB::memAvailSwap.0 = INTEGER: 1023992 kB
UCD-SNMP-MIB::memTotalReal.0 = INTEGER: 1021588 kB
UCD-SNMP-MIB::memAvailReal.0 = INTEGER: 634260 kB
UCD-SNMP-MIB::memTotalFree.0 = INTEGER: 1658252 kB
UCD-SNMP-MIB::memMinimumSwap.0 = INTEGER: 16000 kB
UCD-SNMP-MIB::memBuffer.0 = INTEGER: 30760 kB
UCD-SNMP-MIB::memCached.0 = INTEGER: 216200 kB
UCD-SNMP-MIB::memSwapError.0 = INTEGER: noError(0)
UCD-SNMP-MIB::memSwapErrorMsg.0 = STRING:
Load averages are also available in the UCD SNMP MIB. The SNMP table UCD-SNMP-MIB::laTable has a listing of the 1, 5, and 15 minute load averages:
~]$ snmptable localhost UCD-SNMP-MIB::laTable
SNMP table: UCD-SNMP-MIB::laTable

 laIndex laNames laLoad laConfig laLoadInt laLoadFloat laErrorFlag laErrMessage
       1  Load-1   0.00    12.00         0    0.000000     noError
       2  Load-5   0.00    12.00         0    0.000000     noError
       3 Load-15   0.00    12.00         0    0.000000     noError
파일 시스템과 디스크 정보
The Host Resources MIB provides information on file system size and usage. Each file system (and also each memory pool) has an entry in the HOST-RESOURCES-MIB::hrStorageTable table:
~]$ snmptable -Cb localhost HOST-RESOURCES-MIB::hrStorageTable
SNMP table: HOST-RESOURCES-MIB::hrStorageTable

 Index                                         Type           Descr
AllocationUnits    Size   Used AllocationFailures
     1           HOST-RESOURCES-TYPES::hrStorageRam Physical memory
1024 Bytes 1021588 388064                  ?
     3 HOST-RESOURCES-TYPES::hrStorageVirtualMemory  Virtual memory
1024 Bytes 2045580 388064                  ?
     6         HOST-RESOURCES-TYPES::hrStorageOther  Memory buffers
1024 Bytes 1021588  31048                  ?
     7         HOST-RESOURCES-TYPES::hrStorageOther   Cached memory
1024 Bytes  216604 216604                  ?
    10 HOST-RESOURCES-TYPES::hrStorageVirtualMemory      Swap space
1024 Bytes 1023992      0                  ?
    31     HOST-RESOURCES-TYPES::hrStorageFixedDisk               /
4096 Bytes 2277614 250391                  ?
    35     HOST-RESOURCES-TYPES::hrStorageFixedDisk        /dev/shm
4096 Bytes  127698      0                  ?
    36     HOST-RESOURCES-TYPES::hrStorageFixedDisk           /boot
1024 Bytes  198337  26694                  ?
The OIDs under HOST-RESOURCES-MIB::hrStorageSize and HOST-RESOURCES-MIB::hrStorageUsed can be used to calculate the remaining capacity of each mounted file system.
I/O data is available both in UCD-SNMP-MIB::systemStats (ssIORawSent.0 and ssIORawRecieved.0) and in UCD-DISKIO-MIB::diskIOTable. The latter provides much more granular data. Under this table are OIDs for diskIONReadX and diskIONWrittenX, which provide counters for the number of bytes read from and written to the block device in question since the system boot:
~]$ snmptable -Cb localhost UCD-DISKIO-MIB::diskIOTable
SNMP table: UCD-DISKIO-MIB::diskIOTable

 Index Device     NRead  NWritten Reads Writes LA1 LA5 LA15    NReadX NWrittenX
...
    25    sda 216886272 139109376 16409   4894   ?   ?    ? 216886272 139109376
    26   sda1   2455552      5120   613      2   ?   ?    ?   2455552      5120
    27   sda2   1486848         0   332      0   ?   ?    ?   1486848         0
    28   sda3 212321280 139104256 15312   4871   ?   ?    ? 212321280 139104256
네트워크 정보
Information on network devices is provided by the Interfaces MIB. IF-MIB::ifTable provides an SNMP table with an entry for each interface on the system, the configuration of the interface, and various packet counters for the interface. The following example shows the first few columns of ifTable on a system with two physical network interfaces:
~]$ snmptable -Cb localhost IF-MIB::ifTable
SNMP table: IF-MIB::ifTable

 Index Descr             Type   Mtu    Speed      PhysAddress AdminStatus
     1    lo softwareLoopback 16436 10000000                           up
     2  eth0   ethernetCsmacd  1500        0 52:54:0:c7:69:58          up
     3  eth1   ethernetCsmacd  1500        0 52:54:0:a7:a3:24        down
Network traffic is available under the OIDs IF-MIB::ifOutOctets and IF-MIB::ifInOctets. The following SNMP queries will retrieve network traffic for each of the interfaces on this system:
~]$ snmpwalk localhost IF-MIB::ifDescr
IF-MIB::ifDescr.1 = STRING: lo
IF-MIB::ifDescr.2 = STRING: eth0
IF-MIB::ifDescr.3 = STRING: eth1
~]$ snmpwalk localhost IF-MIB::ifOutOctets
IF-MIB::ifOutOctets.1 = Counter32: 10060699
IF-MIB::ifOutOctets.2 = Counter32: 650
IF-MIB::ifOutOctets.3 = Counter32: 0
~]$ snmpwalk localhost IF-MIB::ifInOctets
IF-MIB::ifInOctets.1 = Counter32: 10060699
IF-MIB::ifInOctets.2 = Counter32: 78650
IF-MIB::ifInOctets.3 = Counter32: 0
Extending Net-SNMP
The Net-SNMP Agent can be extended to provide application metrics in addition to raw system metrics. This allows for capacity planning as well as performance issue troubleshooting. For example, it may be helpful to know that an email system had a 5-minute load average of 15 while being tested, but it is more helpful to know that the email system has a load average of 15 while processing 80,000 messages a second. When application metrics are available via the same interface as the system metrics, this also allows for the visualization of the impact of different load scenarios on system performance (for example, each additional 10,000 messages increases the load average linearly until 100,000).
A number of the applications that ship with Fedora extend the Net-SNMP Agent to provide application metrics over SNMP. There are several ways to extend the agent for custom applications as well. This section describes extending the agent with shell scripts and Perl plug-ins. It assumes that the net-snmp-utils and net-snmp-perl packages are installed, and that the user is granted access to the SNMP tree as described in Configuring Authentication.
Extending Net-SNMP with Shell Scripts
The Net-SNMP Agent provides an extension MIB (NET-SNMP-EXTEND-MIB) that can be used to query arbitrary shell scripts. To specify the shell script to run, use the extend directive in the /etc/snmp/snmpd.conf file. Once defined, the Agent will provide the exit code and any output of the command over SNMP. The example below demonstrates this mechanism with a script which determines the number of httpd processes in the process table.
|
proc 지시문 사용하기
The Net-SNMP Agent also provides a built-in mechanism for checking the process table via the |
The exit code of the following shell script is the number of httpd processes running on the system at a given point in time:
#!/bin/sh

NUMPIDS=`pgrep httpd | wc -l`

exit $NUMPIDS
To make this script available over SNMP, copy the script to a location on the system path, set the executable bit, and add an extend directive to the /etc/snmp/snmpd.conf file. The format of the extend directive is the following:
extend name prog args… where name is an identifying string for the extension, prog is the program to run, and args are the arguments to give the program. For instance, if the above shell script is copied to /usr/local/bin/check_apache.sh, the following directive will add the script to the SNMP tree:
extend httpd_pids /bin/sh /usr/local/bin/check_apache.sh
이 스크립트는 그런 다음에 `NET-SNMP-EXTEND-MIB::nsExtendObjects`에서 질의 될 수 있습니다 :
~]$ snmpwalk localhost NET-SNMP-EXTEND-MIB::nsExtendObjects
NET-SNMP-EXTEND-MIB::nsExtendNumEntries.0 = INTEGER: 1
NET-SNMP-EXTEND-MIB::nsExtendCommand."httpd_pids" = STRING: /bin/sh
NET-SNMP-EXTEND-MIB::nsExtendArgs."httpd_pids" = STRING: /usr/local/bin/check_apache.sh
NET-SNMP-EXTEND-MIB::nsExtendInput."httpd_pids" = STRING:
NET-SNMP-EXTEND-MIB::nsExtendCacheTime."httpd_pids" = INTEGER: 5
NET-SNMP-EXTEND-MIB::nsExtendExecType."httpd_pids" = INTEGER: exec(1)
NET-SNMP-EXTEND-MIB::nsExtendRunType."httpd_pids" = INTEGER: run-on-read(1)
NET-SNMP-EXTEND-MIB::nsExtendStorage."httpd_pids" = INTEGER: permanent(4)
NET-SNMP-EXTEND-MIB::nsExtendStatus."httpd_pids" = INTEGER: active(1)
NET-SNMP-EXTEND-MIB::nsExtendOutput1Line."httpd_pids" = STRING:
NET-SNMP-EXTEND-MIB::nsExtendOutputFull."httpd_pids" = STRING:
NET-SNMP-EXTEND-MIB::nsExtendOutNumLines."httpd_pids" = INTEGER: 1
NET-SNMP-EXTEND-MIB::nsExtendResult."httpd_pids" = INTEGER: 8
NET-SNMP-EXTEND-MIB::nsExtendOutLine."httpd_pids".1 = STRING:
Note that the exit code ("8" in this example) is provided as an INTEGER type and any output is provided as a STRING type. To expose multiple metrics as integers, supply different arguments to the script using the extend directive. For example, the following shell script can be used to determine the number of processes matching an arbitrary string, and will also output a text string giving the number of processes:
#!/bin/sh

PATTERN=$1
NUMPIDS=`pgrep $PATTERN | wc -l`

echo "There are $NUMPIDS $PATTERN processes."
exit $NUMPIDS
The following /etc/snmp/snmpd.conf directives will give both the number of httpd PIDs as well as the number of snmpd PIDs when the above script is copied to /usr/local/bin/check_proc.sh:
extend httpd_pids /bin/sh /usr/local/bin/check_proc.sh httpd
extend snmpd_pids /bin/sh /usr/local/bin/check_proc.sh snmpd
The following example shows the output of an snmpwalk of the nsExtendObjects OID:
~]$ snmpwalk localhost NET-SNMP-EXTEND-MIB::nsExtendObjects
NET-SNMP-EXTEND-MIB::nsExtendNumEntries.0 = INTEGER: 2
NET-SNMP-EXTEND-MIB::nsExtendCommand."httpd_pids" = STRING: /bin/sh
NET-SNMP-EXTEND-MIB::nsExtendCommand."snmpd_pids" = STRING: /bin/sh
NET-SNMP-EXTEND-MIB::nsExtendArgs."httpd_pids" = STRING: /usr/local/bin/check_proc.sh httpd
NET-SNMP-EXTEND-MIB::nsExtendArgs."snmpd_pids" = STRING: /usr/local/bin/check_proc.sh snmpd
NET-SNMP-EXTEND-MIB::nsExtendInput."httpd_pids" = STRING:
NET-SNMP-EXTEND-MIB::nsExtendInput."snmpd_pids" = STRING:
...
NET-SNMP-EXTEND-MIB::nsExtendResult."httpd_pids" = INTEGER: 8
NET-SNMP-EXTEND-MIB::nsExtendResult."snmpd_pids" = INTEGER: 1
NET-SNMP-EXTEND-MIB::nsExtendOutLine."httpd_pids".1 = STRING: There are 8 httpd processes.
NET-SNMP-EXTEND-MIB::nsExtendOutLine."snmpd_pids".1 = STRING: There are 1 snmpd processes.
|
정수 종료 코드는 제한됩니다
Integer exit codes are limited to a range of 0–255. For values that are likely to exceed 256, either use the standard output of the script (which will be typed as a string) or a different method of extending the agent. |
This last example shows a query for the free memory of the system and the number of httpd processes. This query could be used during a performance test to determine the impact of the number of processes on memory pressure:
~]$ snmpget localhost \
    'NET-SNMP-EXTEND-MIB::nsExtendResult."httpd_pids"' \
    UCD-SNMP-MIB::memAvailReal.0
NET-SNMP-EXTEND-MIB::nsExtendResult."httpd_pids" = INTEGER: 8
UCD-SNMP-MIB::memAvailReal.0 = INTEGER: 799664 kB
Perl과 함께 Net-SNMP 확장하기
Executing shell scripts using the extend directive is a fairly limited method for exposing custom application metrics over SNMP. The Net-SNMP Agent also provides an embedded Perl interface for exposing custom objects. The net-snmp-perl package provides the NetSNMP::agent Perl module that is used to write embedded Perl plug-ins on Fedora.
The NetSNMP::agent Perl module provides an agent object which is used to handle requests for a part of the agent’s OID tree. The agent object’s constructor has options for running the agent as a sub-agent of snmpd or a standalone agent. No arguments are necessary to create an embedded agent:
use NetSNMP::agent (':all');

my $agent = new NetSNMP::agent();
The agent object has a register method which is used to register a callback function with a particular OID. The register function takes a name, OID, and pointer to the callback function. The following example will register a callback function named hello_handler with the SNMP Agent which will handle requests under the OID .1.3.6.1.4.1.8072.9999.9999:
$agent->register("hello_world", ".1.3.6.1.4.1.8072.9999.9999",
                 \&hello_handler);
|
root OID 획득하기
The OID |
The handler function will be called with four parameters, HANDLER, REGISTRATION_INFO, REQUEST_INFO, and REQUESTS. The REQUESTS parameter contains a list of requests in the current call and should be iterated over and populated with data. The request objects in the list have get and set methods which allow for manipulating the OID and value of the request. For example, the following call will set the value of a request object to the string "hello world":
$request->setValue(ASN_OCTET_STR, "hello world");
The handler function should respond to two types of SNMP requests: the GET request and the GETNEXT request. The type of request is determined by calling the getMode method on the request_info object passed as the third parameter to the handler function. If the request is a GET request, the caller will expect the handler to set the value of the request object, depending on the OID of the request. If the request is a GETNEXT request, the caller will also expect the handler to set the OID of the request to the next available OID in the tree. This is illustrated in the following code example:
my $request;
my $string_value = "hello world";
my $integer_value = "8675309";

for($request = $requests; $request; $request = $request->next()) {
  my $oid = $request->getOID();
  if ($request_info->getMode() == MODE_GET) {
    if ($oid == new NetSNMP::OID(".1.3.6.1.4.1.8072.9999.9999.1.0")) {
      $request->setValue(ASN_OCTET_STR, $string_value);
    }
    elsif ($oid == new NetSNMP::OID(".1.3.6.1.4.1.8072.9999.9999.1.1")) {
      $request->setValue(ASN_INTEGER, $integer_value);
    }
  } elsif ($request_info->getMode() == MODE_GETNEXT) {
    if ($oid == new NetSNMP::OID(".1.3.6.1.4.1.8072.9999.9999.1.0")) {
      $request->setOID(".1.3.6.1.4.1.8072.9999.9999.1.1");
      $request->setValue(ASN_INTEGER, $integer_value);
    }
    elsif ($oid < new NetSNMP::OID(".1.3.6.1.4.1.8072.9999.9999.1.0")) {
      $request->setOID(".1.3.6.1.4.1.8072.9999.9999.1.0");
      $request->setValue(ASN_OCTET_STR, $string_value);
    }
  }
}
When getMode returns MODE_GET, the handler analyzes the value of the getOID call on the request object. The value of the request is set to either string_value if the OID ends in ".1.0", or set to integer_value if the OID ends in ".1.1". If the getMode returns MODE_GETNEXT, the handler determines whether the OID of the request is ".1.0", and then sets the OID and value for ".1.1". If the request is higher on the tree than ".1.0", the OID and value for ".1.0" is set. This in effect returns the "next" value in the tree so that a program like snmpwalk can traverse the tree without prior knowledge of the structure.
The type of the variable is set using constants from NetSNMP::ASN. See the perldoc for NetSNMP::ASN for a full list of available constants.
이 예제 펄 플러그인(Perl plug-in)을 위해 나열한 전체 코드는 다음과 같습니다:
#!/usr/bin/perl

use NetSNMP::agent (':all');
use NetSNMP::ASN qw(ASN_OCTET_STR ASN_INTEGER);

sub hello_handler {
  my ($handler, $registration_info, $request_info, $requests) = @_;
  my $request;
  my $string_value = "hello world";
  my $integer_value = "8675309";

  for($request = $requests; $request; $request = $request->next()) {
    my $oid = $request->getOID();
    if ($request_info->getMode() == MODE_GET) {
      if ($oid == new NetSNMP::OID(".1.3.6.1.4.1.8072.9999.9999.1.0")) {
        $request->setValue(ASN_OCTET_STR, $string_value);
      }
      elsif ($oid == new NetSNMP::OID(".1.3.6.1.4.1.8072.9999.9999.1.1")) {
        $request->setValue(ASN_INTEGER, $integer_value);
      }
    } elsif ($request_info->getMode() == MODE_GETNEXT) {
      if ($oid == new NetSNMP::OID(".1.3.6.1.4.1.8072.9999.9999.1.0")) {
        $request->setOID(".1.3.6.1.4.1.8072.9999.9999.1.1");
        $request->setValue(ASN_INTEGER, $integer_value);
      }
      elsif ($oid < new NetSNMP::OID(".1.3.6.1.4.1.8072.9999.9999.1.0")) {
        $request->setOID(".1.3.6.1.4.1.8072.9999.9999.1.0");
        $request->setValue(ASN_OCTET_STR, $string_value);
      }
    }
  }
}

my $agent = new NetSNMP::agent();
$agent->register("hello_world", ".1.3.6.1.4.1.8072.9999.9999",
                 \&hello_handler);
To test the plug-in, copy the above program to /usr/share/snmp/hello_world.pl and add the following line to the /etc/snmp/snmpd.conf configuration file:
perl do "/usr/share/snmp/hello_world.pl"
The SNMP Agent Daemon will need to be restarted to load the new Perl plug-in. Once it has been restarted, an snmpwalk should return the new data:
~]$ snmpwalk localhost NET-SNMP-MIB::netSnmpPlaypen
NET-SNMP-MIB::netSnmpPlaypen.1.0 = STRING: "hello world"
NET-SNMP-MIB::netSnmpPlaypen.1.1 = INTEGER: 8675309
[command]#snmpget#은 핸들러의 다른 방식을 실행하는 데에도 사용해야 합니다:
~]$ snmpget localhost \
    NET-SNMP-MIB::netSnmpPlaypen.1.0 \
    NET-SNMP-MIB::netSnmpPlaypen.1.1
NET-SNMP-MIB::netSnmpPlaypen.1.0 = STRING: "hello world"
NET-SNMP-MIB::netSnmpPlaypen.1.1 = INTEGER: 8675309
Want to help? Learn how to contribute to Fedora Docs ›